Kubeshark - Kubernetes Network Observability
Think Wireshark—reimagined for Kubernetes. Capture every packet, inspect every API call, and investigate ongoing and past incidents with complete traffic history—all with minimal production overhead.
Kubeshark delivers cluster-wide, real-time, identity and protocol-aware, visibility into API (L7) and L4 (TCP, UDP, SCTP) traffic, including encrypted (TLS) payloads, as it flows through your containers, pods, namespaces, nodes, and clusters.
Investigate network data with AI-powered natural language prompts. Identify anomalies, detect security threats, optimize costs and improve performance, like never before.
Why Kubeshark?
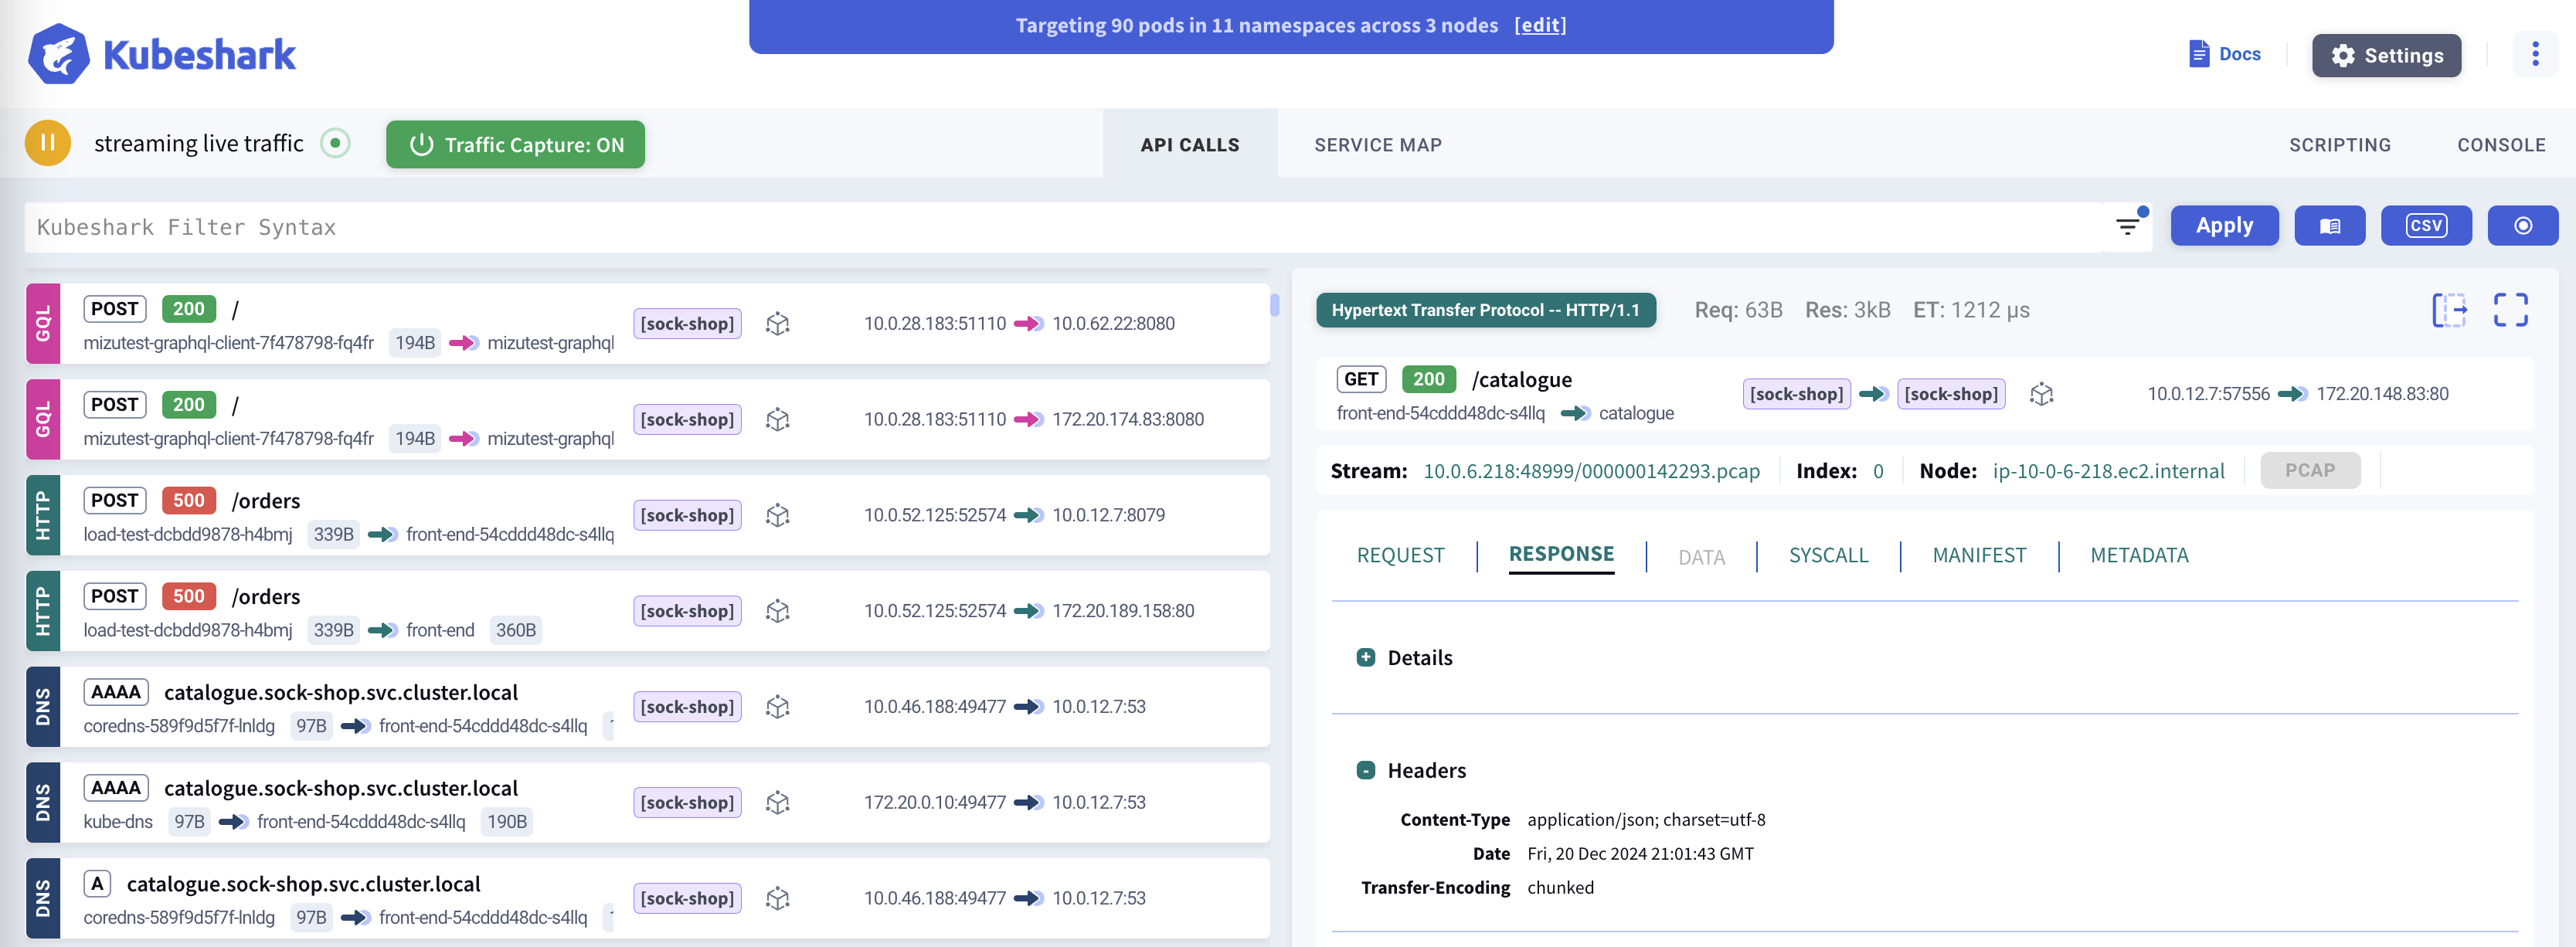
Cluster-Wide API Visibility
Inspect real-time, cluster-wide API calls with full Kubernetes and operating system contexts. Troubleshoot your applications, trace service dependencies, and accelerate root cause analysis.
AI-Powered Root Cause Analysis
Identify root causes at the speed of LLMs. Provide direct access to L4, L7, and API traffic data. Ask in natural language: "Which APIs violate their OAS specs?" or "What services show poor health?"
AI-Driven Incident Response
Never lose a packet. At the onset of an incident—or first symptoms—trigger a snapshot of recent hours traffic from involved workloads and replay every step like CCTV footage.
Continuous Forensics
Store all raw traffic indefinitely and create a snapshot from any time window—days, weeks, or months later. When a customer complains, rewind to the exact moment and replay every packet and API call.
How It Works
Kubeshark offers two powerful modes for different use cases:
Real-Time API Dissection
See traffic as it happens. Kubeshark captures and dissects API calls in real-time, giving you immediate visibility into what’s happening across your cluster. This is ideal for:
- Live debugging - Diagnose issues as they occur
- Root cause analysis - See the exact request/response that caused a failure
- Development workflows - Watch API calls while testing
Traffic Recording & Deferred Analysis
For comprehensive forensics, Kubeshark can capture complete L4 traffic (PCAP) and analyze it later:
  CAPTURE          STORE           ANALYZE          ENRICH
     |                |                |                |
     v                v                v                v
Lightweight      Complete PCAP    L7 dissection    Kubernetes
L4 capture  ---> retained for ---> on-demand or ---> context
on prod nodes    full history     scheduled        added
This enables:
- Complete traffic history for forensic investigation
- Minimal production overhead when you don’t need real-time analysis
- Long-term retention for compliance and auditing
Protocol Support
Kubeshark supports 20+ protocols across multiple layers, with automatic TLS decryption:
| Category | Protocols |
|---|---|
| HTTP/REST | HTTP/1.0, HTTP/1.1, HTTP/2, WebSocket, GraphQL |
| Messaging | Apache Kafka, AMQP (RabbitMQ), Redis |
| RPC | gRPC over HTTP/2 |
| Authentication | LDAP, RADIUS, DIAMETER |
| Network | DNS, ICMP, TCP, UDP, SCTP |
| Security | TLS (with automatic decryption) |
TLS Decryption: Kubeshark can intercept encrypted traffic without requiring access to private keys by hooking into runtime cryptographic libraries (OpenSSL, Go crypto/tls, BoringSSL).
View full protocol documentation →
AI Integration
Kubeshark connects AI assistants directly to your network data via the Model Context Protocol (MCP)—the open standard for AI tool integration. Ask questions in natural language, investigate incidents, and analyze traffic patterns—all through your preferred AI tool.
Learn more about AI Integration →
Quick Start
Get Kubeshark running in 60 seconds:
# Add the Helm repository
helm repo add kubeshark https://helm.kubeshark.com

# Install Kubeshark
helm install kubeshark kubeshark/kubeshark
Then open the dashboard:
kubectl port-forward svc/kubeshark-front 8899:80Open http://localhost:8899 in your browser.
Next Steps
- Installation Guide - Detailed setup instructions
- Dashboard Overview - Learn the Kubeshark interface
- Best Practices - Production deployment tips
- Capture Filters - Target specific traffic